Who is really behind the hosted accounts on Airbnb? A “pretty” idea that was born as a result of high rental prices in San Francisco and ended up taxing its revenue in Ireland.
Published
Nov 3, 2025
Keywords
liberalization
Summary
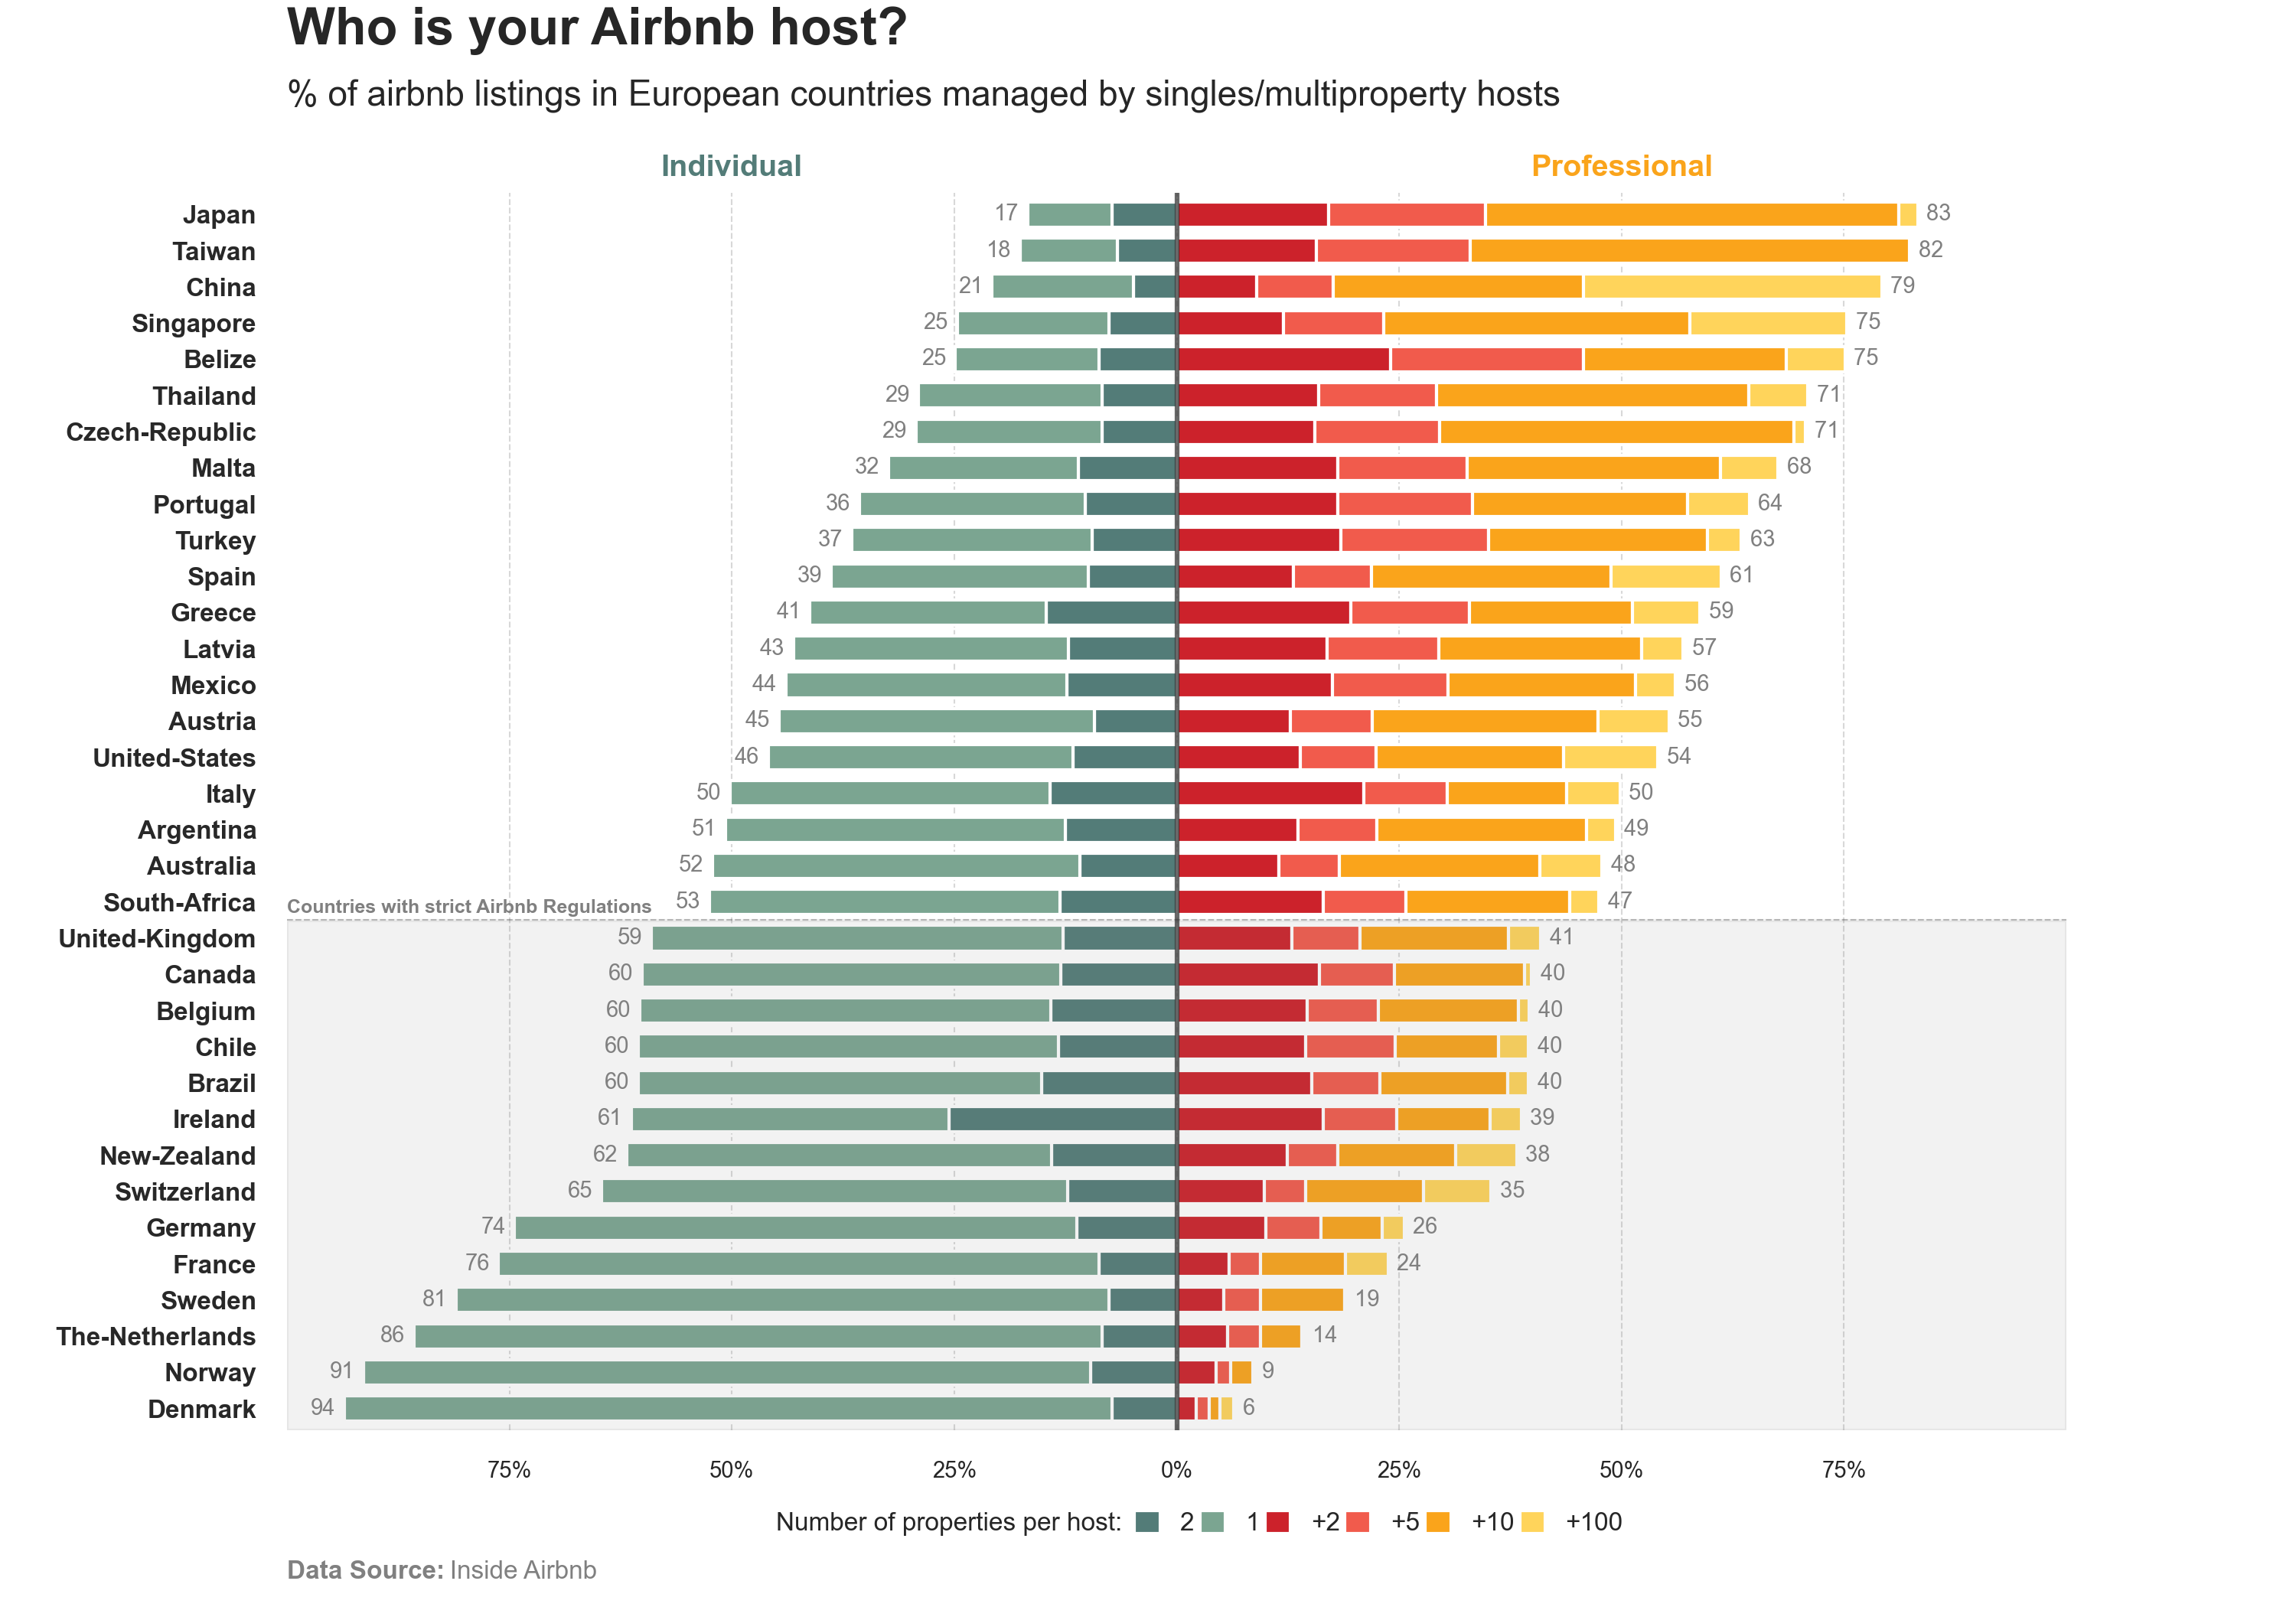
Airbnb, a platform that offers intermediary services between tenants and property owners, has become a challenge in many cities, as well as a controversial topic for defending liberalization and low regulation of the housing market.
This chart is a replica of the one published by Anna Gordun on towardsdatascience, with the addition of direct data extraction using BeautifulSoup and an alternative to her code using pandas and matplotlib.
Code
# Libraries# ==========================================import pandas as pdimport numpy as npimport seaborn as snsimport matplotlib.pyplot as pltimport requestsfrom bs4 import BeautifulSoupfrom io import StringIO# Data Extraction (insideairbnb)# ==========================================# Extract url pages in a dataframeurl ="https://insideairbnb.com/get-the-data/"response = requests.get(url)response.encoding ='utf-8'soup = BeautifulSoup(response.text, 'html.parser')# Get unique URLs that contain 'listings.csv'listings_urls =set(a['href'] for a in soup.find_all('a', href=True) if a['href'].endswith('listings.csv'))# Convert the set back to a DataFramedf_urls = pd.DataFrame(list(listings_urls), columns=["url"])# Add city, province and countrydf_urls['city'] = df_urls['url'].apply(lambda x: x.strip('/').split('/')[-4].title() iflen(x.strip('/').split('/')) >=4elseNone)df_urls['province'] = df_urls['url'].apply(lambda x: x.strip('/').split('/')[-5].title() iflen(x.strip('/').split('/')) >=5elseNone)df_urls['country'] = df_urls['url'].apply(lambda x: x.strip('/').split('/')[-6].title() iflen(x.strip('/').split('/')) >=6elseNone)# Solve empty values df_urls['country'] = df_urls.apply(lambda row: row['city'] if row['province'] =="Data.Insideairbnb.Com"else row['country'], axis=1)df_urls['country'] = df_urls.apply(lambda row: row['province'] if row['country'] =="Data.Insideairbnb.Com"else row['country'], axis=1)df_urls['province'] = df_urls.apply(lambda row: row['city'] if row['province'] =="Data.Insideairbnb.Com"else row['province'], axis=1)# Filter cities and convert to listurls = df_urls.to_dict(orient='records')# Create empty listdfs = []# Iterate over each url and city in the list of dictionariesfor entry in urls: url = entry['url'] city = entry['city'] province = entry['province'] country = entry['country'] response = requests.get(url) df = pd.read_csv(StringIO(response.text), encoding='utf-8') df['city'] = city df['province'] = province df['country'] = country dfs.append(df)# Concatenate dataframesdf = pd.concat(dfs, axis=0, ignore_index=True)# Data Manipulation# ==========================================# Group and category datahost_count = df.groupby(['host_id']).size().reset_index(name='count')bins = [0, 1, 2, 5, 10, 100, float('inf')]labels = ['1', '2', '+2', '+5', '+10', '+100']host_count['host_category'] = pd.cut(host_count['count'], bins=bins, labels=labels, right=True)# Join and select columnsdf = pd.merge(df, host_count, on='host_id', how='left')df = df[['country', 'id', 'host_id', 'host_name', 'host_category', 'count', 'license']]# Check if have licensedf['license_category'] = df['license'].apply(lambda x: 0if pd.isna(x) or x =='Exempt'else1)# Grouping by host categorydf = df.groupby(['country', 'host_category']).agg( {'id': 'count', 'license_category': 'sum'}).reset_index()# Rename columnsdf = df.rename(columns={'id': 'property', 'license_category': 'license'})# Calculate percentsdf['side'] = np.where(df['host_category'].isin(['1', '2']), 'left', 'right')df['property_percent'] = df['property'] / df.groupby('country')['property'].transform('sum') *100df['property_percent'] *= df['side'].eq('left').map({True: -1, False: 1})# Pivot columnsdf_pivot = df.pivot(index="country", columns="host_category", values="property_percent").fillna(0)# Define column with values for individuals and professionalsdf_pivot['total_left'] = df_pivot['1'] + df_pivot['2']df_pivot['total_right'] = df_pivot['+2'] + df_pivot['+5'] + df_pivot['+10'] + df_pivot['+100']df_pivot = df_pivot.sort_values(by='total_left', ascending=True)# Select and order columnsorder = ["2", "1", "+2", "+5", "+10", "+100"]dfplot = df_pivot[order]print(dfplot)# Data Visualization# ==========================================# Font and styleplt.rcParams.update({'font.family': 'sans-serif', 'font.sans-serif': ['Franklin Gothic'], 'font.size': 9})sns.set(style="white", palette="muted")# Palette colorpalette = ["#537c78", "#7ba591", "#cc222b", "#f15b4c", "#faa41b", "#ffd45b"]# Create horizontal stack bar plotax = dfplot.plot(kind="barh", stacked=True, figsize=(10, 7), width=0.7, color=palette)# Add title and labelsax.text(0, 1.12, f'Who is your Airbnb host?', fontsize=16, fontweight='bold', ha='left', transform=ax.transAxes)ax.text(0, 1.07, f'% of airbnb listings in European countries managed by singles/multiproperty hosts', fontsize=11, color='#262626', ha='left', transform=ax.transAxes)ax.set_xlim(-100, 100)xticks = np.linspace(-75, 75, 7)plt.xticks(xticks, labels=[f"{abs(int(i))}%"for i in xticks], fontsize=7)plt.gca().set_ylabel('')plt.yticks(fontsize=8, color='#282828', fontweight='bold')plt.grid(axis='x', linestyle='--', color='gray', linewidth=0.5, alpha=0.3)plt.axvline(x=0, color='#282828', linestyle='-', linewidth=1.5, alpha=0.7)# Add individual and professional textplt.text(0.25, 1.02, 'Individual', fontsize=9.5, fontweight='bold', va='center', ha='center', transform=ax.transAxes, color="#537c78")plt.text(0.75, 1.02, 'Professional', fontsize=9.5, fontweight='bold', va='center', ha='center', transform=ax.transAxes, color="#faa41b")# Add strict regulation zoneynum =14ax.axvspan(-100, 100, ymin=0, ymax=ynum/len(dfplot), color='gray', alpha=0.1)plt.axhline(y=ynum-0.5, color='#282828', linestyle='--', linewidth=0.5, alpha=0.3)plt.text(-100, ynum-0.3, 'Countries with strict Airbnb Regulations', fontsize=6, fontweight='bold', color="gray")# Add values for individual barsfor i, (city, total) inenumerate(zip(dfplot.index, df_pivot['total_left'])): ax.text(total -1, i, f'{abs(total):.0f}', va='center', ha='right', fontsize=7, color='grey')# Add values for professional barsfor i, (city, total) inenumerate(zip(dfplot.index, df_pivot['total_right'])): ax.text(total +1, i, f'{total:.0f} ', va='center', ha='left', fontsize=7, color='grey')# Legend configurationplt.plot([], [], label="Number of properties per host: ", color='white')plt.legend( loc='lower center', bbox_to_anchor=(0.5, -0.1), ncol=7, fontsize=8, frameon=False, handlelength=1, handleheight=1, borderpad=0.2, columnspacing=0.2)# Add Data Sourceplt.text(0, -0.12, 'Data Source:', transform=plt.gca().transAxes, fontsize=8, fontweight='bold', color='gray')space =" "*23plt.text(0, -0.12, space +'Inside Airbnb', transform=plt.gca().transAxes, fontsize=8, color='gray')# Remove spinesfor spine in plt.gca().spines.values(): spine.set_visible(False)# Plot it! :)plt.show()
Code
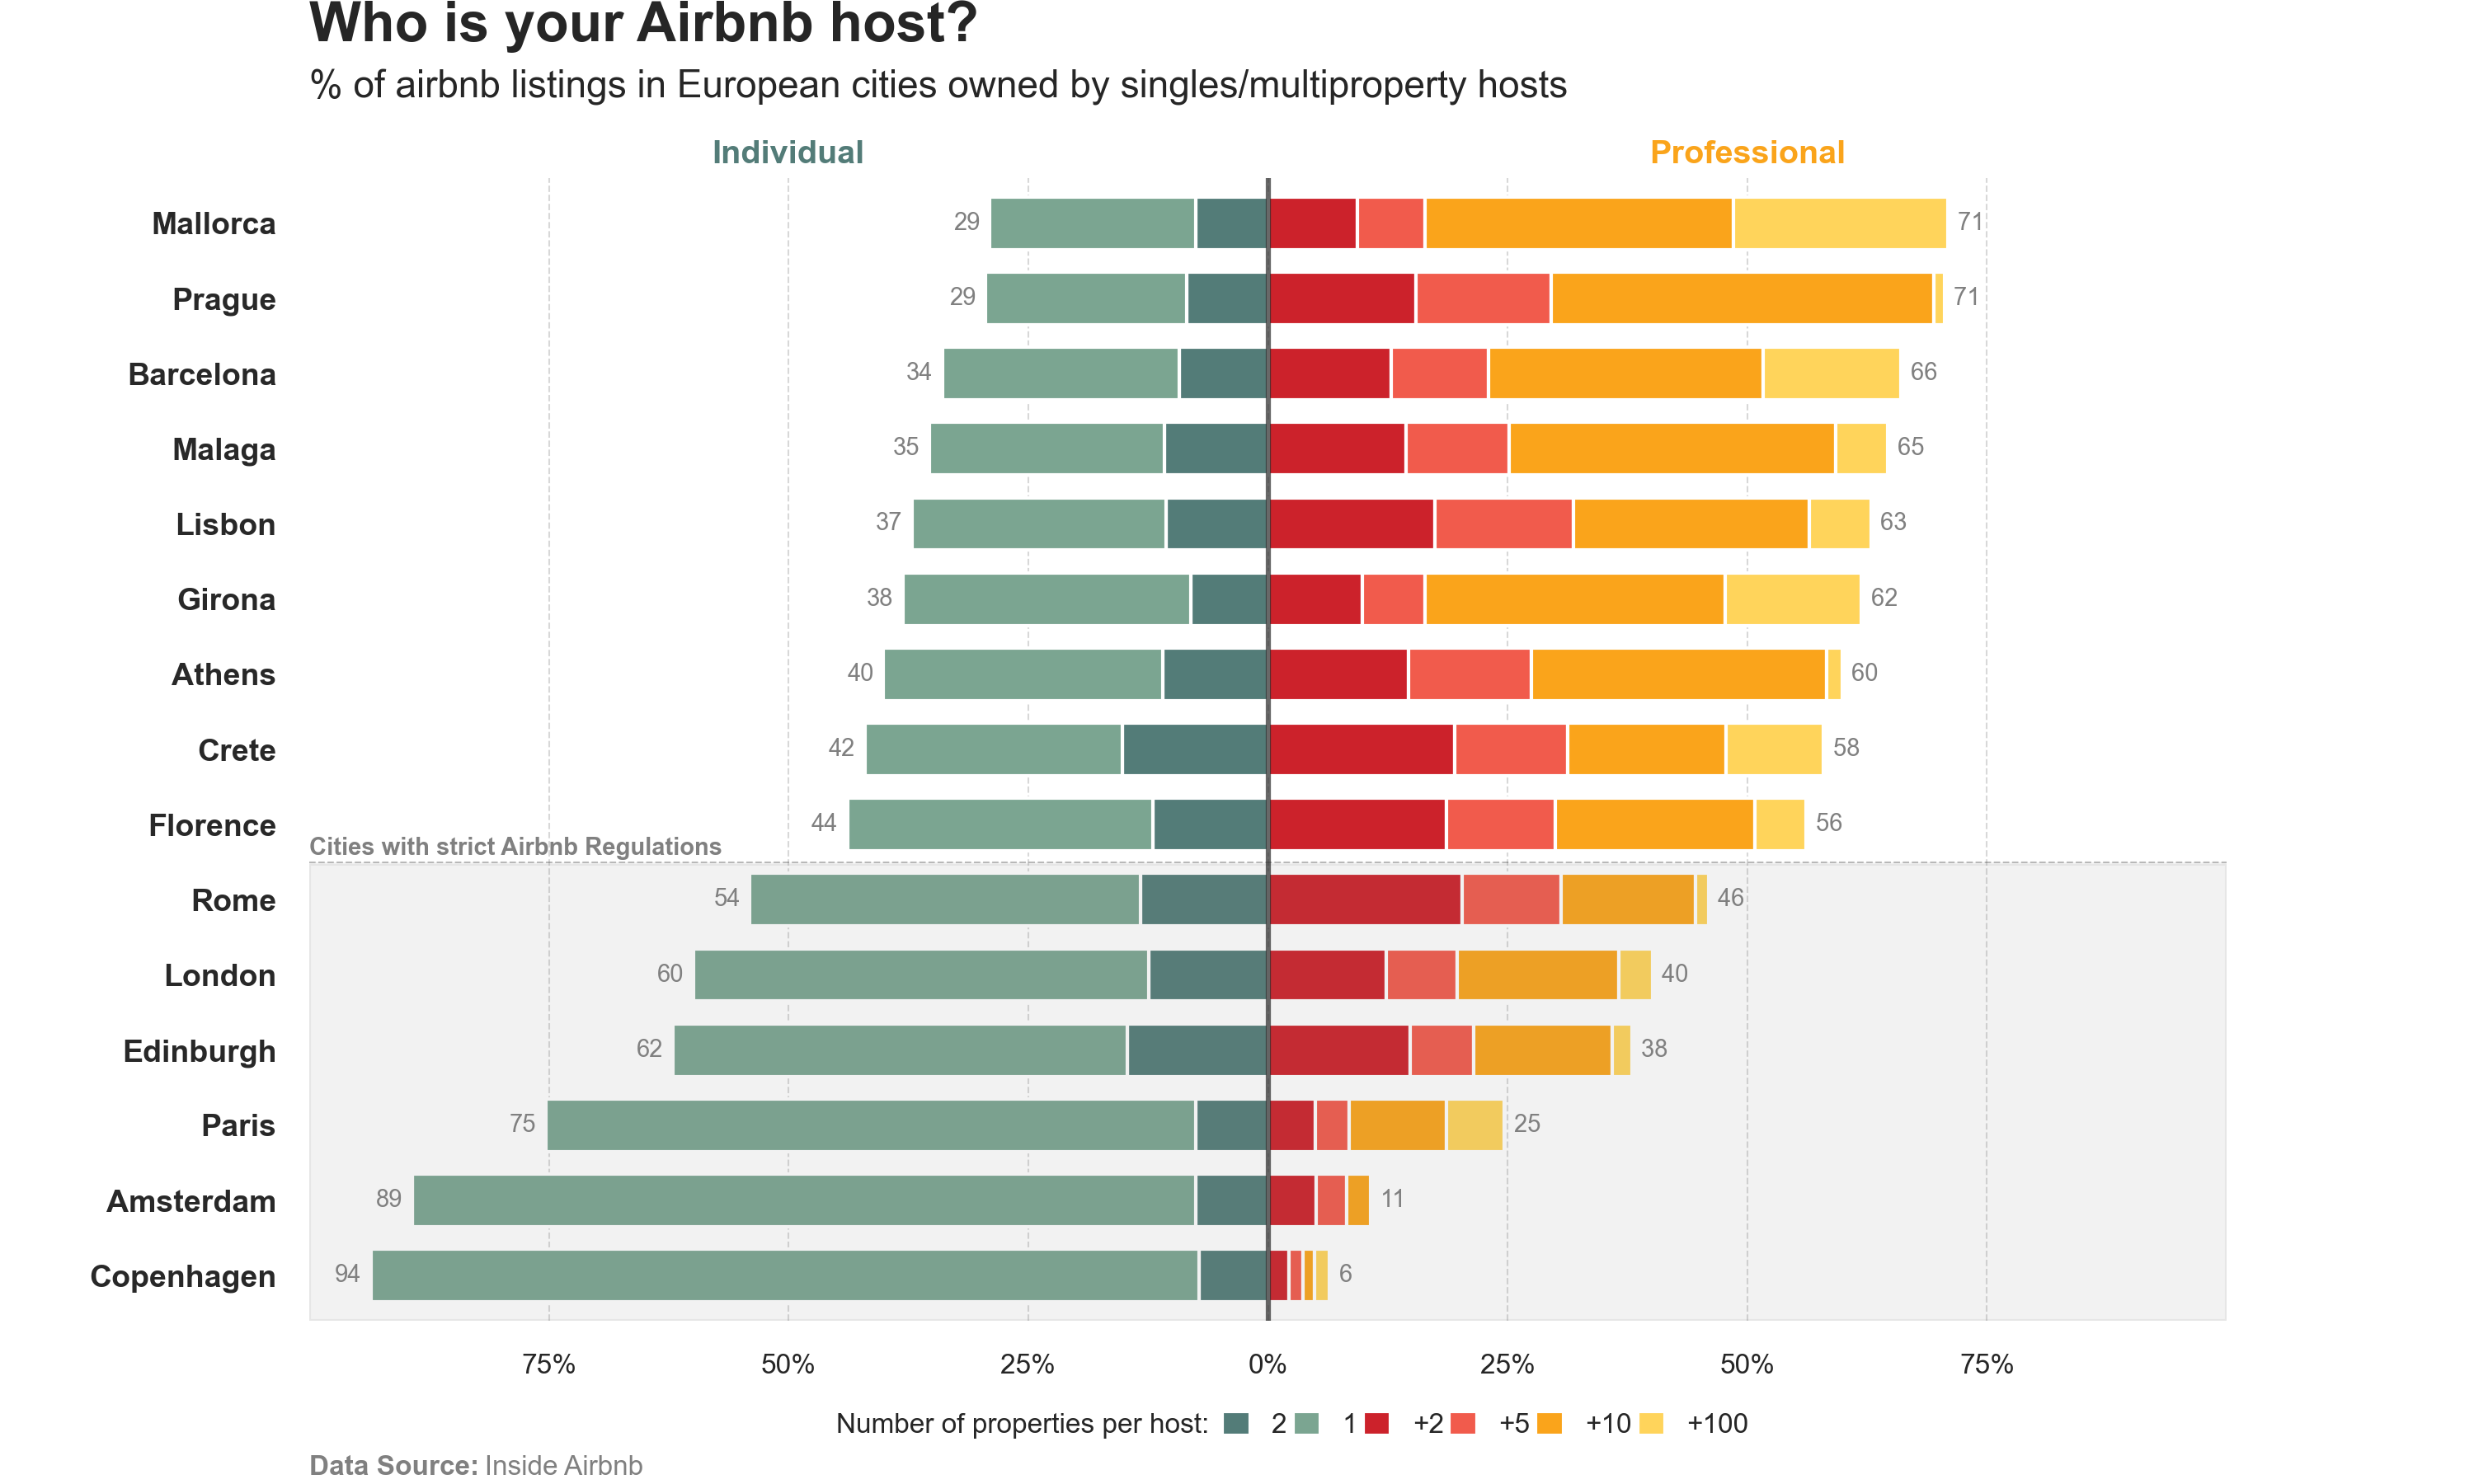
# Libraries# ==========================================import pandas as pdimport numpy as npimport seaborn as snsimport matplotlib.pyplot as pltimport requestsfrom bs4 import BeautifulSoupimport refrom io import StringIO# Data Extraction (insideairbnb)# ==========================================# Extract url pages in a dataframeurl ="https://insideairbnb.com/get-the-data/"response = requests.get(url)response.encoding ='utf-8'soup = BeautifulSoup(response.text, 'html.parser')# Get unique URLs that contain 'listings.csv'listings_urls =set(a['href'] for a in soup.find_all('a', href=True) if a['href'].endswith('listings.csv'))# Convert the set back to a DataFramedf_urls = pd.DataFrame(list(listings_urls), columns=["url"])# Add city, province and countrydf_urls['city'] = df_urls['url'].apply(lambda x: x.strip('/').split('/')[-4].title() iflen(x.strip('/').split('/')) >=4elseNone)df_urls['province'] = df_urls['url'].apply(lambda x: x.strip('/').split('/')[-5].title() iflen(x.strip('/').split('/')) >=5elseNone)df_urls['country'] = df_urls['url'].apply(lambda x: x.strip('/').split('/')[-6].title() iflen(x.strip('/').split('/')) >=6elseNone)# Solve empty values df_urls['country'] = df_urls.apply(lambda row: row['city'] if row['province'] =="Data.Insideairbnb.Com"else row['country'], axis=1)df_urls['country'] = df_urls.apply(lambda row: row['province'] if row['country'] =="Data.Insideairbnb.Com"else row['country'], axis=1)df_urls['province'] = df_urls.apply(lambda row: row['city'] if row['province'] =="Data.Insideairbnb.Com"else row['province'], axis=1)# Filter cities and convert to listcities = {"Girona", "Barcelona", "Amsterdam", "Prague", "Mallorca", "Lisbon", "Malaga", "Athens", "Viena", "Crete", "Florence", "London", "Edinburgh", "Rome", "Paris", "Copenhagen", "Andalucia"}df_urls = df_urls[df_urls['city'].isin(cities)]urls = df_urls.to_dict(orient='records')# Create empty listdfs = []# Iterate over each url and city in the list of dictionariesfor entry in urls: url = entry['url'] city = entry['city'] province = entry['province'] country = entry['country'] response = requests.get(url) df = pd.read_csv(StringIO(response.text), encoding='utf-8') df['city'] = city df['province'] = province df['country'] = country dfs.append(df)# Concatenate dataframesdf = pd.concat(dfs, axis=0, ignore_index=True)# Data Manipulation# ==========================================# Group and category datahost_count = df.groupby(['host_id']).size().reset_index(name='count')bins = [0, 1, 2, 5, 10, 100, float('inf')]labels = ['1', '2', '+2', '+5', '+10', '+100']host_count['host_category'] = pd.cut(host_count['count'], bins=bins, labels=labels, right=True)# Join and select columnsdf = pd.merge(df, host_count, on='host_id', how='left')df = df[['city', 'id', 'host_id', 'host_name', 'host_category', 'count', 'license']]# Check if have licensedf['license_category'] = df['license'].apply(lambda x: 0if pd.isna(x) or x =='Exempt'else1)# Grouping by host categorydf = df.groupby(['city', 'host_category']).agg( {'id': 'count', 'license_category': 'sum'}).reset_index()# Rename columnsdf = df.rename(columns={'id': 'property', 'license_category': 'license'})# Calculate percentsdf['side'] = np.where(df['host_category'].isin(['1', '2']), 'left', 'right')df['property_percent'] = df['property'] / df.groupby('city')['property'].transform('sum') *100df['property_percent'] *= df['side'].eq('left').map({True: -1, False: 1})# Pivot columnsdf_pivot = df.pivot(index="city", columns="host_category", values="property_percent").fillna(0)# Define column with values for individuals and professionalsdf_pivot['total_left'] = df_pivot['1'] + df_pivot['2']df_pivot['total_right'] = df_pivot['+2'] + df_pivot['+5'] + df_pivot['+10'] + df_pivot['+100']df_pivot = df_pivot.sort_values(by='total_left', ascending=True)# Select and order columnsorder = ["2", "1", "+2", "+5", "+10", "+100"]dfplot = df_pivot[order]print(dfplot)# Data Visualization# ==========================================# Font and styleplt.rcParams.update({'font.family': 'sans-serif', 'font.sans-serif': ['Franklin Gothic'], 'font.size': 9})sns.set(style="white", palette="muted")# Palette colorpalette = ["#537c78", "#7ba591", "#cc222b", "#f15b4c", "#faa41b", "#ffd45b"]# Create horizontal stack bar plotax = dfplot.plot(kind="barh", stacked=True, figsize=(10, 6), width=0.7, color=palette)# Add title and labelsax.text(0, 1.12, f'Who is your Airbnb host?', fontsize=16, fontweight='bold', ha='left', transform=ax.transAxes)ax.text(0, 1.07, f'% of airbnb listings in European cities owned by singles/multiproperty hosts', fontsize=11, color='#262626', ha='left', transform=ax.transAxes)ax.set_xlim(-100, 100)xticks = np.linspace(-75, 75, 7)plt.xticks(xticks, labels=[f"{abs(int(i))}%"for i in xticks], fontsize=8)plt.gca().set_ylabel('')plt.yticks(fontsize=9, color='#282828', fontweight='bold')plt.grid(axis='x', linestyle='--', color='gray', linewidth=0.5, alpha=0.3)plt.axvline(x=0, color='#282828', linestyle='-', linewidth=1.5, alpha=0.7)# Add individual and professional textplt.text(0.25, 1.02, 'Individual', fontsize=9.5, fontweight='bold', va='center', ha='center', transform=ax.transAxes, color="#537c78")plt.text(0.75, 1.02, 'Professional', fontsize=9.5, fontweight='bold', va='center', ha='center', transform=ax.transAxes, color="#faa41b")# Add strict regulation zoneynum =6ax.axvspan(-100, 100, ymin=0, ymax=ynum/len(dfplot), color='gray', alpha=0.1)plt.axhline(y=ynum-0.5, color='#282828', linestyle='--', linewidth=0.5, alpha=0.3)plt.text(-100, ynum-0.4, 'Cities with strict Airbnb Regulations', fontsize=7, fontweight='bold', color="gray")# Add values for individual barsfor i, (city, total) inenumerate(zip(dfplot.index, df_pivot['total_left'])): ax.text(total -1, i, f'{abs(total):.0f}', va='center', ha='right', fontsize=7, color='grey')# Add values for professional barsfor i, (city, total) inenumerate(zip(dfplot.index, df_pivot['total_right'])): ax.text(total +1, i, f'{total:.0f} ', va='center', ha='left', fontsize=7, color='grey')# Legend configurationplt.plot([], [], label="Number of properties per host: ", color='white')plt.legend( loc='lower center', bbox_to_anchor=(0.5, -0.12), ncol=7, fontsize=8, frameon=False, handlelength=1, handleheight=1, borderpad=0.2, columnspacing=0.2)# Add Data Sourceplt.text(0, -0.135, 'Data Source:', transform=plt.gca().transAxes, fontsize=8, fontweight='bold', color='gray')space =" "*23plt.text(0, -0.135, space +'Inside Airbnb', transform=plt.gca().transAxes, fontsize=8, color='gray')# Remove spinesfor spine in plt.gca().spines.values(): spine.set_visible(False)# Plot it! :)plt.show()